Introduction
TL;DR Three DHT22 temperature & humidity sensors connected to Raspberry Pi, setup to periodically read data from the sensors, store the data in InfluxDB and visualise the data via Grafana.
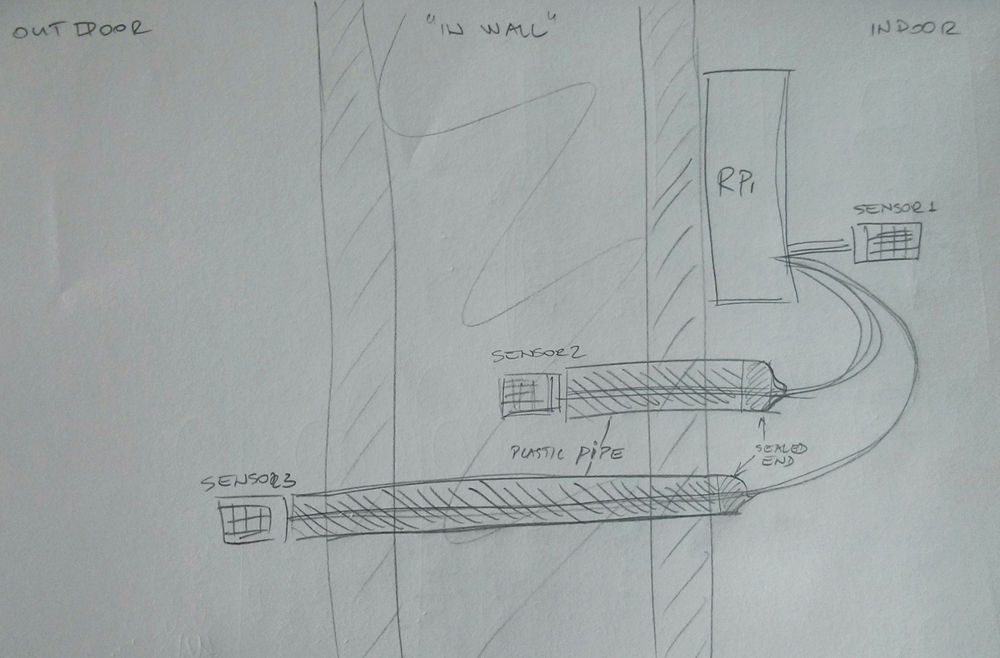
First sensor installed inside, second in wall and third outside of a house to be able to record and visualise its thermal and moisture performance.
Last year at TEDx Christchurch I had an extensive chat about all things related to building houses with Danny Squires from Space Craft Systems, a social enterprise that develops the WikiHouse system in New Zealand.
I told Danny about sensor station that I put together and we discussed possible uses of such stations for houses. Danny asked me if I could help to set something up for the WikiHouse sometime in the future.
Fast forward 12 months, Danny got in touch and asked if I could help to put a demo together for FESTA.
Deadline was tight, but I had all required parts so I could hack it together and lend it to Danny for the festival. After that I can use the setup at home and Danny can use clone of the SD card with the same hardware setup in the future.
I proposed that we use three DHT22 temperature & humidity sensors connected to Raspberry Pi, use InfluxDB for data storage and Grafana for visualisation. It is stack that I am familiar with and can put together fairly quickly.
The reason to use three sensors is to install the first sensor inside, the second in wall and the third outside of a house. That way when data are put together on one chart we can visualise thermal and moisture performance of the house.
For demonstration purposes the pi with the sensors is setup as a desktop computer with charts being displayed on a monitor in full screen.
Here is a sketch I made for Danny to illustrate how the sensors should be installed.
Raspberry Pi Setup
I used a Raspberry Pi 3 and a 16GB SD card with Raspbian Jessie iso installed on it.
I setup the pi, monitor, keyboard and mouse, started it, Raspbian Jessie booted up and PIXEL desktop started.
First thing I always do on newly made SD cards is an upgrade:
pi@raspberrypi:~ $ sudo su -
root@raspberrypi:~# apt-get update
root@raspberrypi:~# apt-get upgrade
And install essentials:
root@raspberrypi:~# apt-get install vim screen mc
After that I expanded the file system via Raspberry -> Preferences -> Raspberry Pi Configuration screen and rebooted the pi.
After the reboot I went to Raspberry Pi Configuration again and disabled the Underscan to remove black border around the screen ie. to use full size of the monitor screen. Another reboot was required.
Lastly, I ran rpi-update and did yet another reboot:
pi@raspberrypi:~ $ sudo su -
root@raspberrypi:~# rpi-update
root@raspberrypi:~# reboot
InfluxDB
I downloaded InfluxDB - Standalone Linux Binaries (ARM) and installed them by hand:
pi@raspberrypi:~ $ sudo su -
root@raspberrypi:~# wget https://dl.influxdata.com/influxdb/releases/influxdb-1.0.2_linux_armhf.tar.gz
root@raspberrypi:~# tar xvfz influxdb-1.0.2_linux_armhf.tar.gz
root@raspberrypi:~# cd influxdb-1.0.2-1/
root@raspberrypi:~/influxdb-1.0.2-1# find .
.
./var
./var/log
./var/log/influxdb
./var/lib
./var/lib/influxdb
./usr
./usr/share
./usr/share/man
./usr/share/man/man1
./usr/share/man/man1/influxd-version.1.gz
./usr/share/man/man1/influxd-backup.1.gz
./usr/share/man/man1/influxd-restore.1.gz
./usr/share/man/man1/influxd.1.gz
./usr/share/man/man1/influxd-config.1.gz
./usr/share/man/man1/influxd-run.1.gz
./usr/share/man/man1/influx.1.gz
./usr/bin
./usr/bin/influxd
./usr/bin/influx_stress
./usr/bin/influx
./usr/bin/influx_tsm
./usr/bin/influx_inspect
./usr/lib
./usr/lib/influxdb
./usr/lib/influxdb/scripts
./usr/lib/influxdb/scripts/influxdb.service
./usr/lib/influxdb/scripts/init.sh
./etc
./etc/logrotate.d
./etc/logrotate.d/influxdb
./etc/influxdb
./etc/influxdb/influxdb.conf
root@raspberrypi:~/influxdb-1.0.2-1# mkdir /var/log/influxdb
root@raspberrypi:~/influxdb-1.0.2-1# mkdir /var/lib/influxdb
root@raspberrypi:~/influxdb-1.0.2-1# mv usr/share/man/man1/influx* /usr/share/man/man1/
root@raspberrypi:~/influxdb-1.0.2-1# mv usr/bin/influx* /usr/bin/
root@raspberrypi:~/influxdb-1.0.2-1# mv usr/lib/influxdb/ /usr/lib/
root@raspberrypi:~/influxdb-1.0.2-1# mv etc/logrotate.d/influxdb /etc/logrotate.d/
root@raspberrypi:~/influxdb-1.0.2-1# mv etc/influxdb/ /etc/
I added influxdb user and group:
root@raspberrypi:~# adduser influxdb
Adding user `influxdb' ...
Adding new group `influxdb' (1001) ...
Adding new user `influxdb' (1001) with group `influxdb' ...
Creating home directory `/home/influxdb' ...
Copying files from `/etc/skel' ...
Enter new UNIX password:
Retype new UNIX password:
No password supplied
Enter new UNIX password:
Retype new UNIX password:
No password supplied
Enter new UNIX password:
Retype new UNIX password:
passwd: password updated successfully
Changing the user information for influxdb
Enter the new value, or press ENTER for the default
        Full Name []:
        Room Number []:
        Work Phone []:
        Home Phone []:
        Other []:
Is the information correct? [Y/n] Y
To finish off the setup, I ran /usr/lib/influxdb/scripts/post-install.sh to make sure that the dirs have the right permissions and that the service is installed correctly.
Then I enabled InfluxDB to start automatically on every boot and rebooted the pi.
root@raspberrypi:/etc/init.d# systemctl enable influxdb
Synchronizing state for influxdb.service with sysvinit using update-rc.d...
Executing /usr/sbin/update-rc.d influxdb defaults
Executing /usr/sbin/update-rc.d influxdb enable
Created symlink from /etc/systemd/system/influxd.service to /lib/systemd/system/influxdb.service.
To make a new database I started influx client and :
root@raspberrypi:~# influx
InfluxDB shell version: 1.0.2
> CREATE DATABASE wikihouse
Installed the latest Python client for InfluxDB via pip:
root@raspberrypi:~# pip install influxdb
Note
I tried to install root@raspberrypi:~# apt-get install python-influxdb first, but that client is old and does not work. Latest client must be used.
Grafana
I found Grafana ARM package for Debian Jessie a.k.a Raspbian at https://github.com/fg2it/grafana-on-raspberry/tree/master/jessie/v3.1.1 ( https://github.com/fg2it/grafana-on-raspberry/blob/master/jessie/v3.1.1/grafana_3.1.1-1470786449_armhf.deb?raw=true ) and installed it via dpkg:
root@raspberrypi:~# wget https://github.com/fg2it/grafana-on-raspberry/blob/master/jessie/v3.1.1/grafana_3.1.1-1470786449_armhf.deb?raw=true
--2016-10-19 03:04:29--  https://github.com/fg2it/grafana-on-raspberry/blob/master/jessie/v3.1.1/grafana_3.1.1-1470786449_armhf.deb?raw=true
Resolving github.com (github.com)... 192.30.253.112
Connecting to github.com (github.com)|192.30.253.112|:443... connected.
HTTP request sent, awaiting response... 302 Found
Location: https://github.com/fg2it/grafana-on-raspberry/raw/master/jessie/v3.1.1/grafana_3.1.1-1470786449_armhf.deb [following]
--2016-10-19 03:04:30--  https://github.com/fg2it/grafana-on-raspberry/raw/master/jessie/v3.1.1/grafana_3.1.1-1470786449_armhf.deb
Reusing existing connection to github.com:443.
HTTP request sent, awaiting response... 302 Found
Location: https://raw.githubusercontent.com/fg2it/grafana-on-raspberry/master/jessie/v3.1.1/grafana_3.1.1-1470786449_armhf.deb [following]
--2016-10-19 03:04:30--  https://raw.githubusercontent.com/fg2it/grafana-on-raspberry/master/jessie/v3.1.1/grafana_3.1.1-1470786449_armhf.deb
Resolving raw.githubusercontent.com (raw.githubusercontent.com)... 151.101.100.133
Connecting to raw.githubusercontent.com (raw.githubusercontent.com)|151.101.100.133|:443... connected.
HTTP request sent, awaiting response... 200 OK
Length: 29602746 (28M) [application/octet-stream]
Saving to: ‘grafana_3.1.1-1470786449_armhf.deb?raw=true’

grafana_3.1.1-1470786449_armhf.deb?raw=true                 100%[===========================================================================================================================================>]  28.23M  4.88MB/s   in 6.1s

2016-10-19 03:05:13 (4.65 MB/s) - ‘grafana_3.1.1-1470786449_armhf.deb?raw=true’ saved [29602746/29602746]

root@raspberrypi:~# mv grafana_3.1.1-1470786449_armhf.deb\?raw\=true grafana_3.1.1-1470786449_armhf.deb
root@raspberrypi:~# dpkg -i grafana_3.1.1-1470786449_armhf.deb
Selecting previously unselected package grafana.
(Reading database ... 122650 files and directories currently installed.)
Preparing to unpack grafana_3.1.1-1470786449_armhf.deb ...
Unpacking grafana (3.1.1-1470786449) ...
Setting up grafana (3.1.1-1470786449) ...
Adding system user `grafana' (UID 112) ...
Adding new user `grafana' (UID 112) with group `grafana' ...
Not creating home directory `/usr/share/grafana'.
### NOT starting on installation, please execute the following statements to configure grafana to start automatically using systemd
 sudo /bin/systemctl daemon-reload
 sudo /bin/systemctl enable grafana-server
### You can start grafana-server by executing
 sudo /bin/systemctl start grafana-server
Processing triggers for systemd (215-17+deb8u5) ...
Then I enabled Grafana to start automatically on every boot and rebooted the pi.
root@raspberrypi:~# systemctl enable grafana-server
Synchronizing state for grafana-server.service with sysvinit using update-rc.d...
Executing /usr/sbin/update-rc.d grafana-server defaults
Executing /usr/sbin/update-rc.d grafana-server enable
Created symlink from /etc/systemd/system/multi-user.target.wants/grafana-server.service to /usr/lib/systemd/system/grafana-server.service.
root@raspberrypi:~# reboot
Grafana is listening on port 3000 so I opened http://localhost:3000/ in a browser and Grafana web interface opened up.
Grafana config docs: http://docs.grafana.org/installation/configuration/
Getting started docs: http://docs.grafana.org/guides/gettingstarted/
Data Collection
Downloaded zip of the Adafruit DHT Python library.
sudo su -
apt-get update
apt-get install build-essential python-dev
wget https://github.com/adafruit/Adafruit_Python_DHT/archive/master.zip
unzip master.zip
cd Adafruit_Python_DHT-master
python setup.py install
pip list | grep -i dht
Once installed, I wrote a Python script to collect and store the collected data in InfluxDB:
import Adafruit_DHT

from datetime import datetime
from influxdb import InfluxDBClient
from influxdb.client import InfluxDBClientError

pin1 = 3
pin2 = 4
pin3 = 22

client = InfluxDBClient('localhost', 8086, 'root', 'root', 'wikihouse')

def save_data(sensor, pin):
    current_time = datetime.now().strftime('%Y-%m-%d %H:%M:%S')
    humidity, temperature = Adafruit_DHT.read_retry(Adafruit_DHT.DHT22, pin)
    if humidity is not None and temperature is not None:
        print('Sensor={0}  Temp={1:0.1f}*C  Humidity={2:0.1f}%'.format(sensor, temperature, humidity))
        json_body = [
            {
                "measurement": "{0}_temperature".format(sensor),
                "tags": {
                    "wikihouse": "festa"
                },
                "timestamp": current_time,
                "fields": {
                    "value": float("{0:0.1f}".format(temperature))
                }
            },
            {
                "measurement": "{0}_humidity".format(sensor),
                "tags": {
                    "wikihouse": "festa"
                },
                "timestamp": current_time,
                "fields": {
                    "value": float("{0:0.1f}".format(humidity))
                }
            }]
        # print(json_body)
        client.write_points(json_body)

save_data('inside', pin1)
save_data('inwall', pin2)
save_data('outside', pin3)
To enable the data collection I simply added the script into cron and executed it every minute:
* * * * * python /home/pi/collect_and_store.py
Conclusion
This project is a simple proof-of-concept of how to collect and store data from DHT22 temperature/humidity sensors and visualise the collected data to see thermal and moisture performance of walls in a house.
Comments
comments powered by Disqus